Visual.2-3 Scatterplot 사용하기
Scatter Plot
: 점을 사용하여 두 feature간의 관계를 알기 위해 사용하는 그래프(산점도)
목적
- 상관 관계 확인(Correlation)
-
군집, 값 사이의 차이, 이상치 확인용
scatter()
variation
- 색
- 모양
- 크기
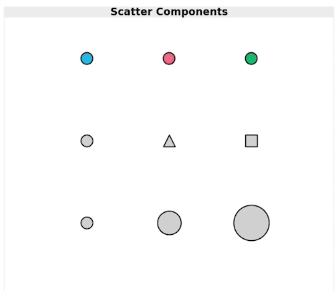
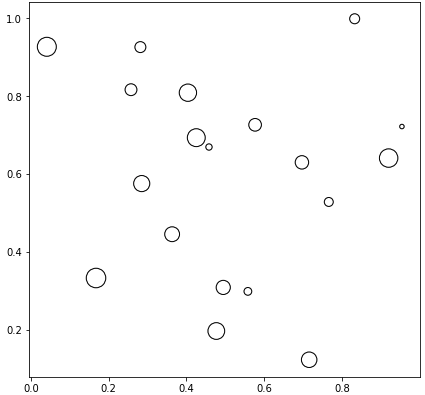
fig = plt.figure(figsize=(7, 7))
ax = fig.add_subplot(111, aspect=1)

np.random.seed(970725)

x = np.random.rand(20)
y = np.random.rand(20)
size = np.arange(20) * 20

ax.scatter(x, y,
           s= size,
           c='white',
           marker='o',
           linewidth=1,
           edgecolor='black')

plt.show()
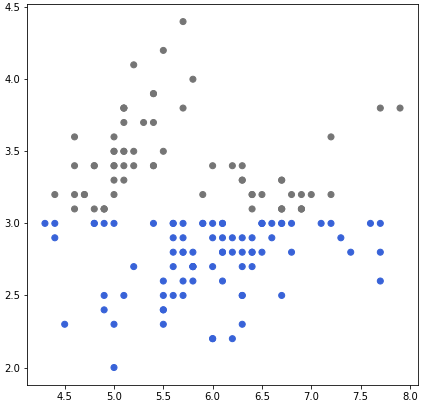
정확한 Scatterplot
특정 조건 부여
ax.scatter(x=iris['SepalLengthCm'],
           y=iris['SepalWidthCm'],
           c=['royalblue' if yy <= swc_mean else 'gray' for yy in iris['SepalWidthCm']]
          )
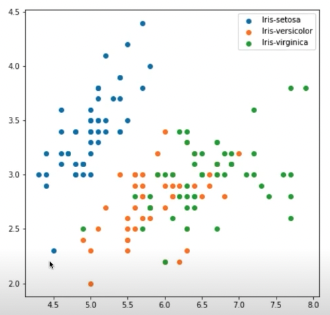
범례 사용시 따로 그리는 방법
fig = plt.figure(figsize=(7, 7))
ax = fig.add_subplot(111)

for species in iris['Species'].unique():
    iris_sub = iris[iris['Species']==species]
    ax.scatter(x=iris_sub['SepalLengthCm'],
               y=iris_sub['SepalWidthCm'],
               label=species)

ax.legend()
plt.show()
Overplotting
점이 많아질수록 분포 파악 힘듬
- 투명도 조절
- Jittering : 점의 위치를 약간식 변경
- 2차원 히스토그램 : 히트맵으로 깔끔한 시각화
- Contour plot : 등고선
점의 요소와 인지
- 색 : 가장 확실한 방법
- 마커 : 구별 거의 힘듬, 크기가 고르지 않음 (비추)
- 크기 : bubble chart 라고 부름 / 구별 쉽지만 오용되기 쉬움
인과관계와 상관관계
causal relation : 인과관계 correlation : 상관 관계 분석과정에서 꼭 고려해볼것
추세선
scatter의 패턴 유추
ETC
grid는 scatter에서 지양. 만약 사용한다면 무채색에 최소한으로.
범주형이 포함된 관계에서는 heatmap 또는 bubble chart 추천
댓글남기기